An interview with Nathaniel Heller, Results for Development. Originally published here
By now, I think we can all agree that we’ve reached the peak of big data, returned to base camp, washed our kit and started planning the next climb. For a short while, big data was presented as the solution to all our problems. The premise was simple — collect more data, make it look pretty, push it out and people would start using it to make decisions that would end poverty, expose corruption and reverse unsustainable exploitation of our environment.
But things didn’t work out that way. In the rush to deliver data to the people, the people forgot the people. Bigger didn’t mean better and data dashboards became graveyards filled with withering flowers.
Data designed for the living need to be centered around humans and the unique needs we all have. Results for Development (R4D) is an organisation that puts the users of data at the centre of all their efforts to achieve sustainable progress in health, education and nutrition. I spoke to Nathaniel Heller, Executive Vice President for Integrated Strategies at R4D to learn more about their user-centric approach to data and the importance of thinking ‘small’ when it comes to helping people make better use of data.
“There’s a mistaken belief that if we present people with pretty data, good decisions will happen,” said Nathaniel. “But data isn’t the only input into decision-making. You have to consider the capacity of the governments or organisations involved to carry out the task they’ve been given and what hurdles they have to overcome. The use of data in decision-making is much more nuanced than simply making more data available.”
R4D works with change agents to find long-lasting solutions. Focusing on identifying important and transformational data, R4D will only invest in data tools if there’s a strong case for it. “Sometimes it seems like there’s a data problem,” explained Nathaniel, “but once you start talking to people about what they need, you’ll see there’s another underlying issue that has nothing to do with the data.” It’s these underlying issues that R4D’s user-centric approach to problem solving uncovers.
To illustrate his point, Nathaniel told me about a current project that he’s particularly excited about. R4D spent about year poring over all different kinds of country-level agricultural data in several African countries to identify opportunities for agricultural transformation — the kind of macro shift that has the potential to lift tens of millions out of poverty and address nutritional needs. The initial idea was to create a dashboard and open up access to the data, assuming this would motivate national political leaders to embrace a push for change. But when R4D spotted an opportunity in the data (only a tiny percentage of smallholder farmers in Kenya use inorganic fertilizer), they decided to shift strategies.
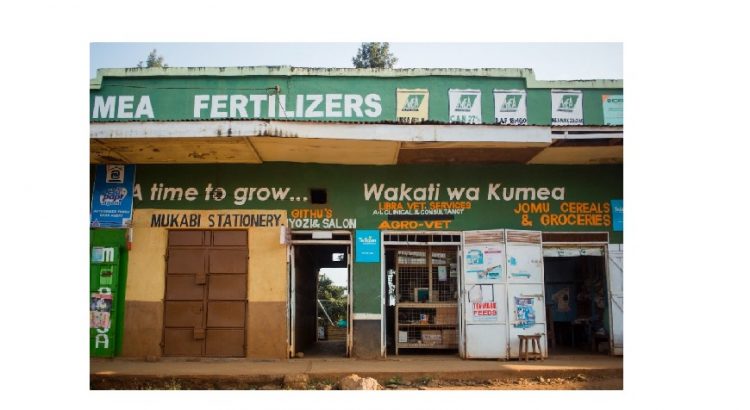
In Kenya, getting the right fertiliser can be an expensive and time consuming effort for farmers. A half-day journey to the market might end with the purchase of the wrong fertilizer, or worse, a counterfeit product that does more harm than good. R4D and their partners at the Local Development Research Institute saw an opportunity to create a service that would help people locate the right fertiliser, for the right price, from a location within easy travelling distance.
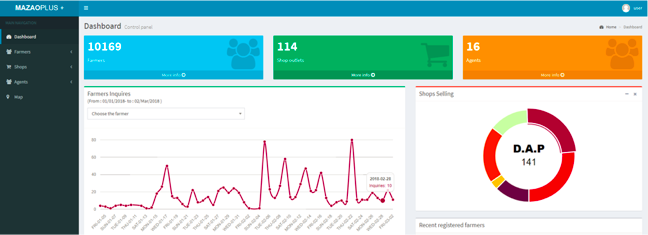
MazaoPlus+, an SMS service for farmers (and its accompanying Android app used by field agents to onboard users) was built in just two weeks. More than 10,000 farmers have already subscribed to receive fertiliser advice via their phones. We have to wait until harvest time to see if the app has helped improve yields through improved access to fertilizer, but Nathaniel sees a great potential in this service, both in terms of the agricultural impact and potential for scaling up into something bigger.
“The Kenyan fertiliser SMS service is a good example of our methods where we emphasise fit-for-purpose principles when it comes to leveraging data; we often focus on the small data, not the big data,” said Nathaniel. “We thought it through first and built second; which is exactly how every project should go.”
Small data is a term that’s never been as popular as big data but it describes data that are presented in a volume and format that’s easy for humans to access and use. Whereas reams of big data can be collected and processed by artificial intelligence, small data is curated by humans for other humans. The personal touch of small data ensures the solutions being developed to improve education, healthcare and agricultural systems are meeting a real need and supporting change.
On their website, R4D speaks about “artificial solutions”, whereby resource-constrained governments find themselves forced to adopt data-for-development tools without adequate planning or data uptake strategies. I asked Nathaniel how these artificial solutions could be avoided. “When someone proposes a solution, you start by asking, ‘has anyone (other than the funder) asked for this?’” said Nathaniel. “If they say yes, good, but if not you need to dig deeper and ask more questions. Structured interviews with potential users provides lots of interesting feedback that will help you understand their needs and pain points, enabling you to determine if the root cause of their problems really is a data issue, or something else entirely.”
Talking and listening to your users to learn what they need is common sense but it’s always worth reminding ourselves why. As Nathaniel and R4D have shown, understanding the needs of people and developing a solution that’s tailored to them will always be more effective than taking a ‘store-bought’ solution and moulding it to their situation. After all, one-size-fits-all rarely fits anyone. When — and only when — data is identified as the true issue, every care must be taken to curate it and package it in ways that are accessible, usable and useful for the users. These are principles Vizzuality shares with R4D, so let’s think small when it comes to big data.
